
UML diagrams, also known as the Unified Modeling Language diagrams, are a collection of diagrams designed to visually illustrate the design, architecture, and execution of a software system. Simply put, these diagrams act as the system’s blueprint and document how it may look in static form and during execution.
Typically, a well-crafted UML diagram shows accurate class structure, clear relationships, and behavior of actors. Moreover, it uses a standard modeling language, which is the same for all programming languages. Therefore, they are highly beneficial for software developers and engineers in understanding the system’s mechanics.
Today, these diagrams are used across IT, education, and business industries. But wait for the twist! UML diagrams come in different types, depending on their purpose. Want to know more about the types of UML diagrams? Keep on reading.
In this article
Part I. Class Diagrams
 below.
  below.
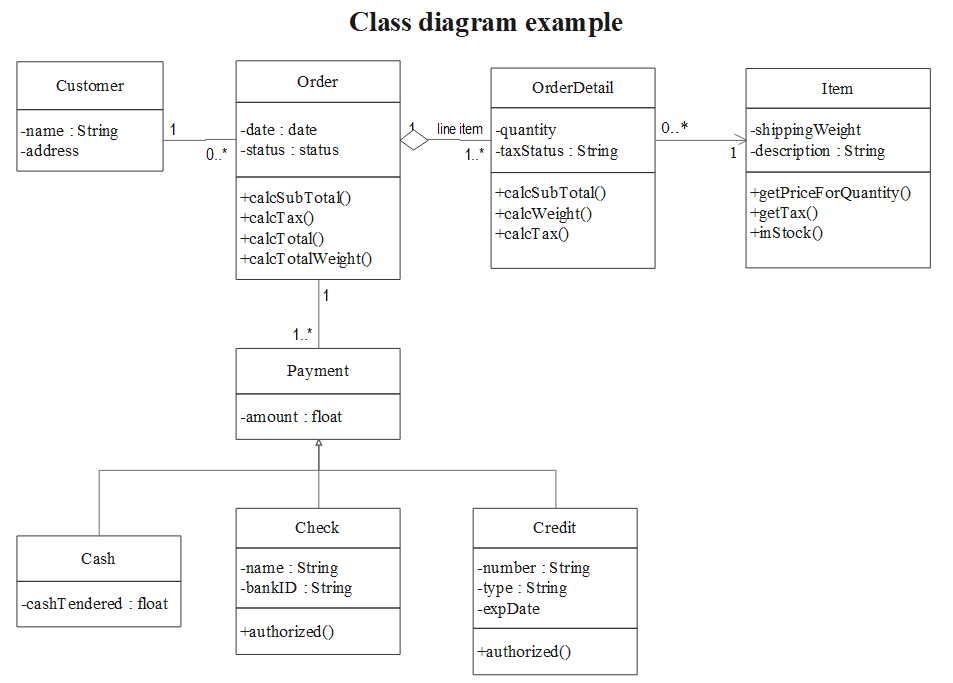
 The basis of any object-oriented solution is a class diagram. It displays a system's classes, along with each class's properties, operations, and relationships to other classes.
Key elements in class diagrams
The following list includes the main components of the class diagram. Together, these components form an effective class diagram. These components include:
- Classes
- Attributes
- Methods
- Visibility Notations
- Associations
- Aggregation and Composition
- Inheritance
- Dependency
- Association Class
- Multiplicity and Role Names
Symbols used in class diagram
Visibility symbols are used to evaluate how easily available the information is in classes. Remember that "+" indicates public activities while "-" indicates private ones. Additionally, protected operations use the prefix "#". As was already said, class diagrams can display links between classes.
Examples and use cases of class diagrams
There are several uses for class diagrams. Here are a few examples of how they assist businesses and developers:
- A software development strategy can be created by a class diagram
- Assistance with code creation
Class diagrams can also be used for requirements analysis by outlining the business processes that the application will support.
Part II. Use Case Diagrams
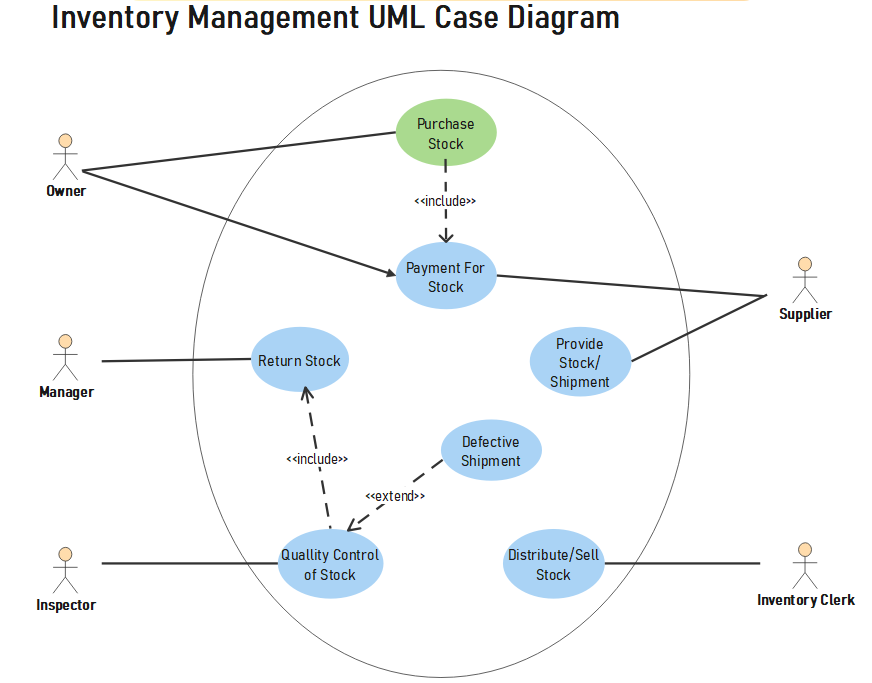
Use case diagrams provide a visual breakdown of the method's actors, the various functions those actors require, and how those functions interact.
Actors and their Relationship
The interaction between the software system and outside entities is depicted in a use-case diagram. Actors are the names given to these outside parties. Actors play roles that might be external hardware, other systems, or human users.
Use cases are shown in an oval shape with labels. Stick figures represent the actors in the process, and a line connecting the actors and use case models their involvement in the system. You can draw a box all the way around the use case to represent the system boundary.
Examples and use cases of use case diagrams
There are typically several use cases for each phase in a software or platform's process, along with an index. For instance,
- Distinct reports for adding an item to the cart
- Choosing a payment method
- Selecting a shipping and delivery option
These may be included in use cases relating to an online e-commerce purchase.
Part III. Sequence Diagrams
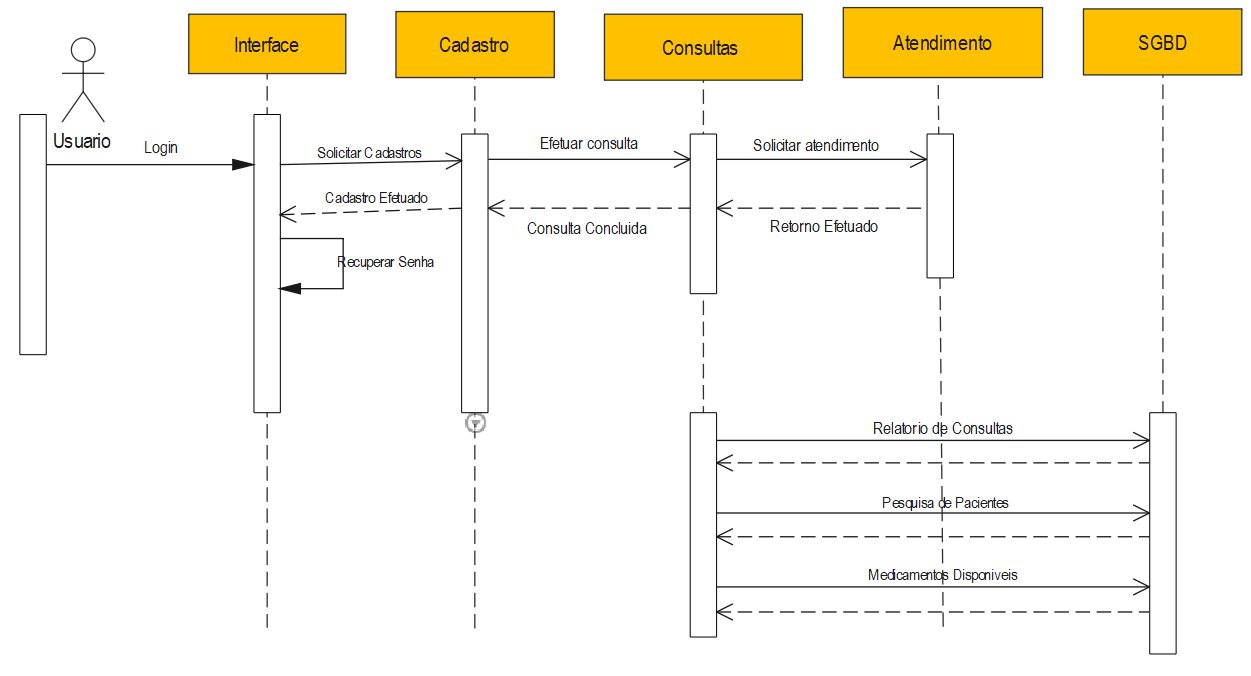
The flow of communication and control structures between objects is shown in a sequence diagram. For instance, in a sequence diagram for a banking scenario, lifelines might stand in for a client, teller, or bank manager.
Lifelines, messages, and activation boxes in sequence diagrams
An activation box displays the duration of an item or actor doing an action in a sequence diagram. The activation rectangle is placed on top of an item lifeline. The completion time is placed at the bottom of the rectangle and the beginning of the time at its top.
An interaction between objects, or between an item and its surroundings, is represented by a message. An event, a triggered activity, or a basic operation can all be messages. A message describes a particular form of communication in the metamodel.
Examples and use cases of sequence diagrams
The behavior of a system can be explained to stakeholders using sequence diagrams, including users, developers, and managers. This can ensure that everyone is well-versed in the operation of the system.
Part IV. Activity Diagrams
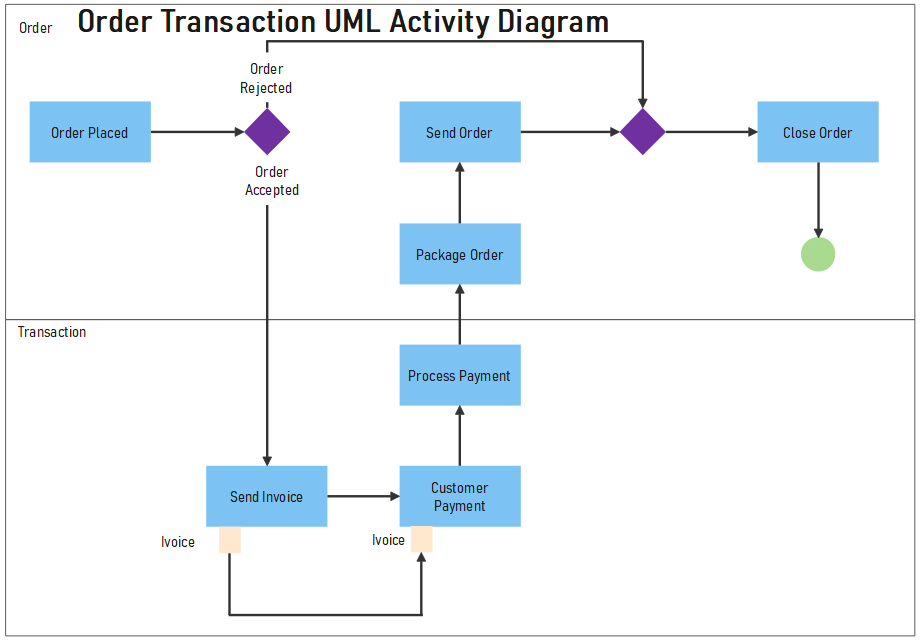
A type of Unified Modeling Language (UML) diagram called an "activity diagram" depicts the progression of one activity across a system or process. It is referred to as a "behavior diagram" because it outlines what ought to occur in the modeled system. It is used to depict the many dynamic characteristics of a system.
It shows the algorithm's logic in action. Furthermore, it outlines the actions taken in a UML use case. For example:
- Draw a workflow or business process between users and the system.
- Clarify complex use cases to streamline and enhance any workflow.
Nodes, edges, and control flow in activity diagrams
To simulate the flow of activities, you may utilize two different types of activity edges:
- The transfer of control from one node to another is modeled by control flow edges.
- The movement of items or data from one node to another is modeled by object flow edges.
Use cases of activity diagrams
A flowchart of an activity may be used to represent the process of setting up a blog account.
- Particularly effective in modeling business processes are activity diagrams.
- An organized sequence of tasks, such as sending client orders, is a business process.
Part V. State Machine Diagrams
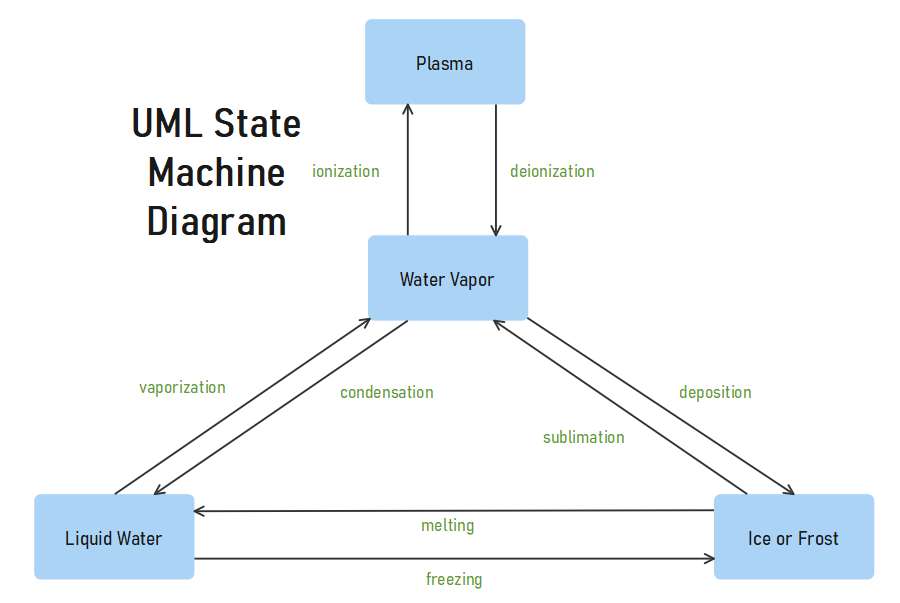
The series of events that an object experiences throughout the course of its existence in reaction to events are specified in a state machine diagram. It describes the behavior of a single object. The states that a door passes through during the course of its existence are depicted in the state machine diagram below as an example.
There are three possible states for the door: "Opened," "Closed," or "Locked." The events Open, Close, Lock, and Unlock can trigger a response from them.
Purpose of the State-Machine Diagram:
The purpose of the state-dependent behavior of an item is generally described using state-machine diagrams. Depending on its state, an item reacts to a given event in a variety of ways.
Use-cases and Examples
State diagrams serve a variety of use cases, like other UML diagrams. The following are the primary applications:
- Illustrating reactive systems with event-driven components
- Presenting use case examples in a professional setting.
- Describing the different states that an object goes through during the course of its lifespan.
- Displaying a state machine's overall behavior or the behavior of a group of similar state machines
Part VI. Component Diagrams
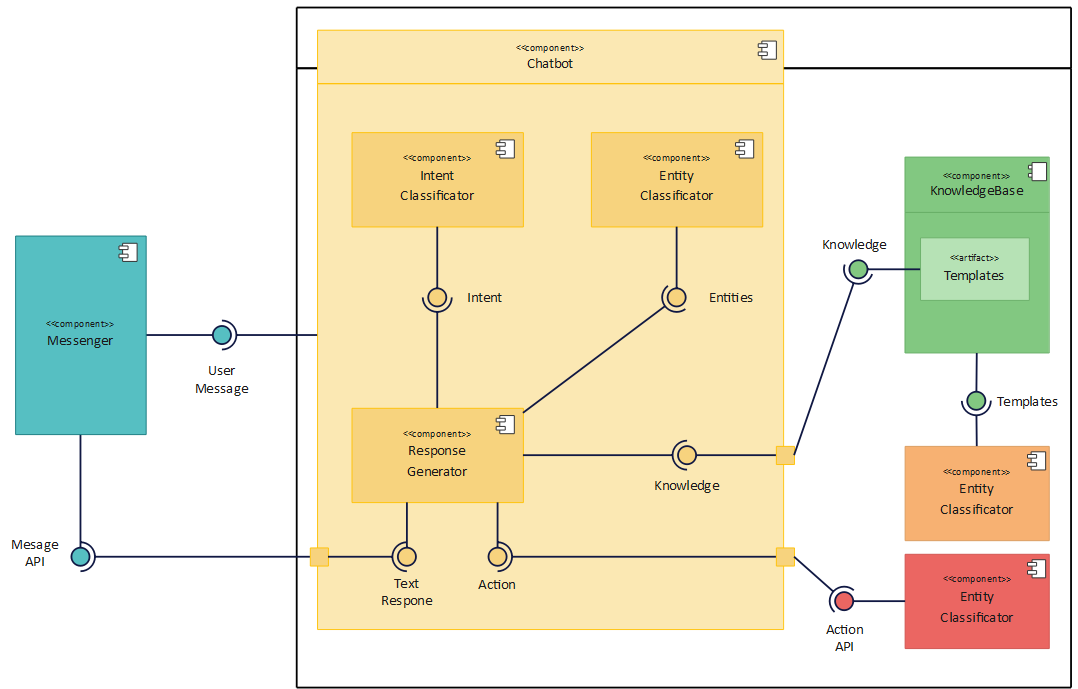
Component diagrams, which are basically class diagrams that concentrate on a system's components. They are frequently used to depict the static implementation from inside a system and are a subset of class diagrams. A component diagram's purpose is to represent the interrelationships between various system components.
Component diagrams in UML display the architecture of the software system, describing each software component's interfaces and relationships. Component diagrams can be used to represent software systems at a high level or to display components at a more detailed, package level.
Example and use case of Hardware
This offers a broad overview of the parts that make up a system. A hardware component, such as
- Circuit
- Microchip
- Gadget
Example and use case as software
Software component, such as
- A database
- User interface
Example and use case as Business
or a business unit, such as a
- supplier
- payroll
- shipping
All of the points mentioned above could be components.
Part VII. Deployment Diagrams
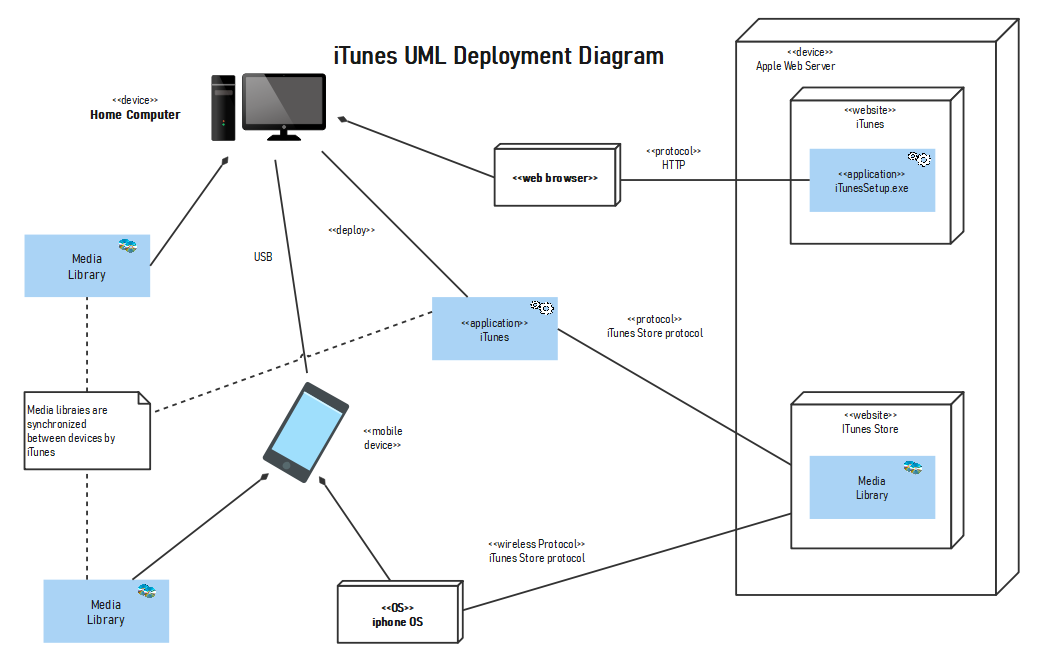
A deployment diagram displays the locations of components and artifacts inside the deployed system. It outlines the arrangement of the system's parts and artifacts.
The purpose of the Deployment Diagram is to visualize the hardware components of the system. The communication paths and the locations of the software files that will run on that hardware.
Nodes, artifacts, and connections in deployment diagrams
In this type of UML diagram, nodes represent physical or virtual resources. On the other hand, connections display the deployment of objects on nodes, and artifacts show software elements. There are two types of nodes:
- Runtime Context Node
- Machine Nodes
Examples and use cases of deployment diagrams
System deployment settings are represented using deployment diagrams. Examples include:
- Presenting the deployment of microservices in a cloud-based system
- Mapping the distribution of IoT devices in a network
- Showing how the components of a web application are spread among servers
These diagrams support resource allocation, system monitoring, and system design.
Conclusion
In this article, we have discussed various types of UML diagrams, each serving a unique purpose in software development. From basic class diagrams, which outline a system`s structure, to high-level diagrams, which show how a system interacts with its user.
Selecting the right UML diagram is crucial for each modeling need, promoting cooperation, simplifying communication, boosting documentation, and aiding problem-solving. Utilizing these tools enhances software development efficiency and complexity.
Though creating these diagrams might take a little time, using tools like Edrawmax might simplify the procedure. These resources encourage creativity and teamwork in the world of technology, allowing teams to complete their software development tasks successfully.